If only it was that simple…
Banks are the most economically sensitive segment of the financial sector. Not surprisingly, their stock prices fluctuate in response to economic news, forecasts, and expectations that may or may not be proven accurate. However, the “fair” or “intrinsic” values of their stocks do not change as much since those are driven by actual economic profits and things are not as simple when one looks into some of the drivers of such profits. More specifically, US banks are enjoying two meaningful tailwinds. Namely, rising interest rates and loan growth. In addition, they are well positioned for higher credit losses if the Fed fails in its “soft landing” efforts and a mild recession with increasing unemployment materializes later this year or next.
Investor sentiment
These days it is hard to escape reports of daily stock market performance. The popular narrative is based on the idea that inflation requires a policy response by central banks that increases the risk of an economic recession. Supply chain constraints, the impact of the war in Ukraine on commodities, and monetary and fiscal stimulus to offset the impacts of other pandemic-related policies are often identified as the drivers of inflation.
For a number of citizens and individual investors, all that may matter is the picture below which shows the performance of stock market, financial sector, US bank, and consumer discretionary sector proxies so far this year as of today’s market close.
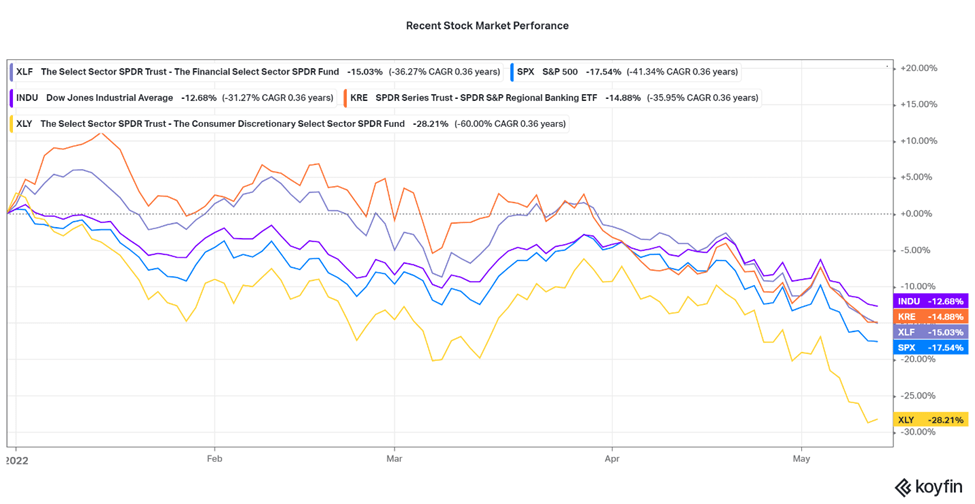
In the graph above, KRE is the US Regional Bank ETF, XLF is the US Financial Sector ETF, and XLY is the US Consumer Discretionary Sector ETF.
“Regionals” are commonly viewed as more exposed to the real economy in the US than their international mega-bank competitors. Their performance so far this year makes “intuitive” sense to most people but as it often happens in life, “intuition” is only the starting point of any attempt to understand an issue.
It is commonly believed that banks cannot grow revenues and may lose significant amounts from their lending activities during recessions. However, US banks can and, historically, have grown revenues during recessions and are currently benefiting from two significant tailwinds that should enable them to grow revenues this year and probably next based on current expectations.
In terms of the impact of credit losses on bottom lines, it is worth considering not only the quality of the loan books of US banks (not discussed here) compared to non-bank lenders and their history, the composition of their loan books and the “excess” reserves for loan losses in place that were boosted significantly in 2020 and were only partially reversed in 2021.

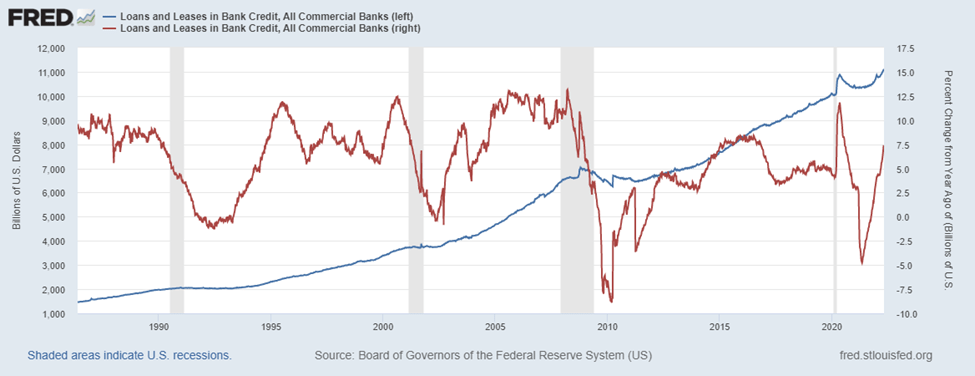
Looking at “recent” economic recessions (shaded grey periods above), banks were able to grow revenue in 1991, 2002, and 2008 (though, fees declined), but not in 2020 (though, fees jumped). In 2022, they should be able to significantly grow spread revenue (green bars) but fees (blue bars) will probably decline, which should have a proportionately larger impact on the Wall St. type banks as it is well understood.
Rising interest rates and loan growth are boosting revenue growth this year
In 2021, a little less than two-thirds of total revenue for US banks was derived from “net interest income” or “spread revenue”. There are two factors driving higher spread income in 2022: rising interest rates and loan growth. In a recent report, the OCC (bank regulator) estimated the benefit from rising interest rates for about 1,000 mid-size and community banks to be 4-7% of spread income for the median bank. For the broader industry, with spread revenue of $530.4 billion in 2021 this would equate to $21-37 billion of growth in 2021.
Industry loans are growing at a 7.3% Y/Y rate as of the most recent data. There are $11.3 trillion of loans, industry-wide, so every 1% of growth equates to $113 billion in incremental loans, which at a 3.5% hypothetical spread, adds $3.3 billion of revenue or a little over 0.60% of spread income growth and about 0.40% of total revenue growth.
Various fees accounted for the other third (~60% for the mega-banks) of revenues, on an industry basis in 2021. There are several reasons fees were already expected to decline in 2022, including the normalization of the better-than-expected capital market-related fee generation by larger banks since the start of the pandemic. From a top-down perspective, assuming fees drop to 2018-2019 levels they would decline $30-35 billion from 2021 levels. In aggregate, the industry should be able to more than offset the impact of this decline from spread income growth (as discussed) and that would be even easier for regional banks.
Reserves for credit losses already reflect the expectation of higher credit losses
During 2015-2019, US banks in aggregate were adding 1.2-1.3x the level of annual net charge-offs (i.e. actual write-offs of loans in blue bars below) through provisions (red bars) to their reserves for loan losses, after under provisioning in 2010-2014, following the Global Financial Crisis.
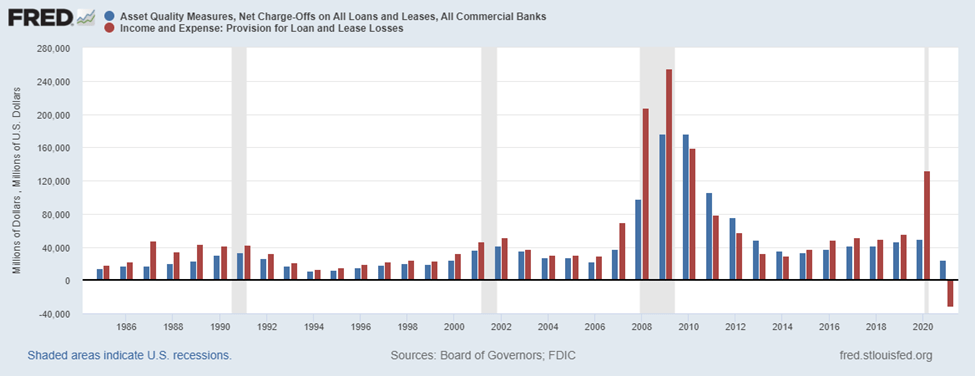
In 2020 (under new accounting rules), they provisioned $132.5 billion or 2.7x the level of credit losses which allowed for $31.3 billion of reversals in 2021.
According to weekly industry data, banks had reserves equal to 1.41% of loans in late April of 2022 which compares to 1.07% in March 2020 and 2.10% in November 2020 when reserve levels peaked under the new accounting regime which went into effect on January 1, 2020, for all US financial institution, except for community banks. The current accounting standard requires that banks have enough reserves for expected lifetime losses in their loan books. The current differential between reserve levels today compared to pre-pandemic of about 0.40% drops to 0.30% if one assumes 7% annual loan growth in 2022.
For the system, actual credit losses were 0.44-51% of average loans in 2014-2020 and dropped to 0.25% in 2021. Traditionally, US banks have carried reserves equal to about 2-2.5x times of annual net credit losses depending on loan mix. So, the 1.41% current level or 1.32% if we assume 7% loan growth would imply that expected lifetime losses are in the 0.50-0.60% annual NCO ratio range which appears reasonable assuming a mild recession. Indicatively, in 2001 the industry NCO rate increased 0.25% followed by another increase of about 0.15% in 2002, peaking at 0.97% for the industry. During that time period, the US unemployment rate rose to 6.3% (June 2003) from 3.8% (April 2000) while the fed was cutting interest rates (from the end of 2000 to mid-2004) after tightening in 1998-2000.